

1. Enabling the New Ticket Dashboard
To move from the legacy single-table view to the modern, widget-based interface:
- Navigate to the Service Desk module via the left sidebar.
- Locate the Service Desk main header at the top of the screen.
- Click the Three Dots (⋮) icon on the far right of the header.
Toggle on the New Dashboard Beta switch.
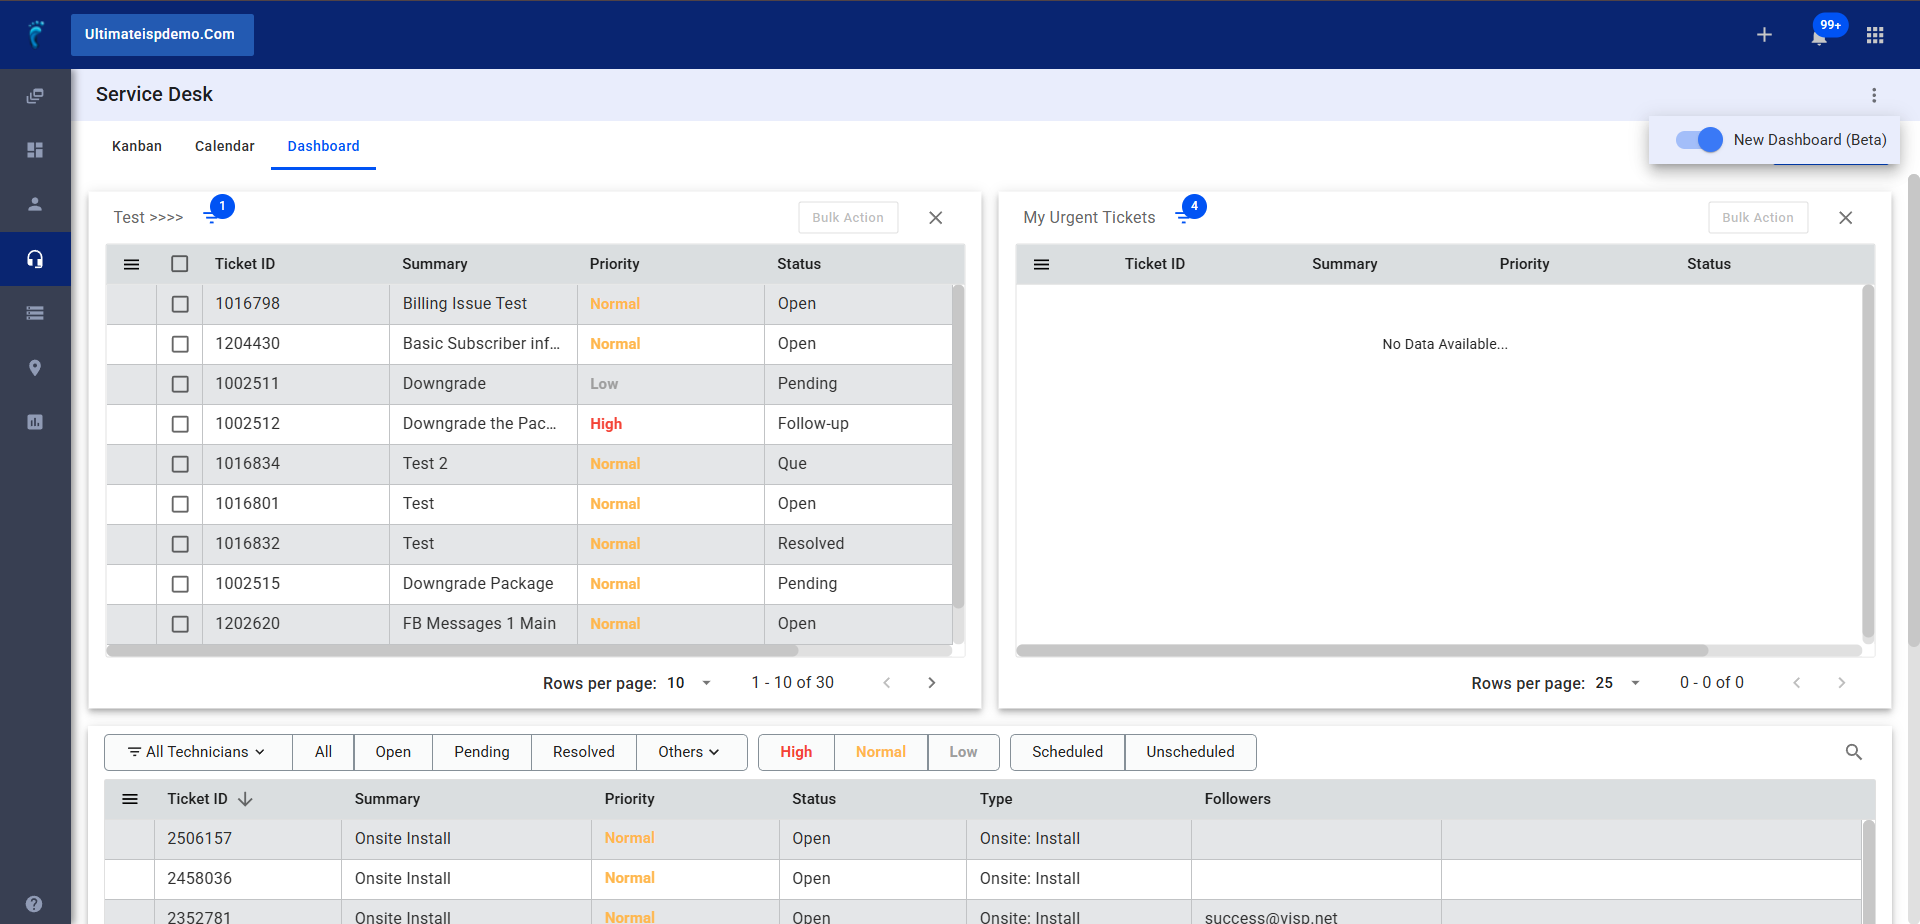
2. Creating Specialized Ticket Views (Widgets)
The new dashboard allows you to create multiple “cards” or tables filtered by specific criteria.
- Click the blue + Add Filter button at the top right.
- In the configuration window, define your view:
- Title: Enter a custom label for this specific ticket card (e.g., “My Urgent Tickets”).
- Assignee: Select a specific technician or group to monitor.
- Statuses: Choose which ticket states to include (e.g., Open, Pending).
- Ticket Types: Filter by specific categories (e.g., Onsite Install, Billing).
- Set Due Date logic:
- Select a condition from the dropdown: Less than, Greater than, or Due today.
- Specify the timeframe using the Days, Weeks, or Months fields.
- Click Save to add the widget to your dashboard.
3. Managing and Organizing Dashboard Widgets
- Rearrange: Click and hold the header of any card to Drag and Drop it to a new location on the screen.
- Resize: Widgets are designed to occupy half the space of a standard table, allowing side-by-side comparisons.
- Modify Filters: Click the Filter Icon located directly beside the widget title to update its conditions.
- Column Customization: Click the Menu (☰) icon within a specific card to choose which columns are visible.
4. Data Export and Accessibility
- Subscriber Settings: Within the column settings, you can toggle the option to Include tickets of deleted subscribers.
- Export: Click the Export button to download the current filtered list as a CSV file.
- Mobile View: The dashboard is fully responsive; it will automatically scale and adjust its layout for mobile phone browsers.