

Visp’s Report Builder lets you create custom reports where you can choose the fields and set specific conditions.
Here are some tips when adding new reports:
-
- Define the Purpose of the Report : Determine what questions this report is meant to answer. For example, it could be to understand invoice and revenue trends, to track subscriber setup dates, or to evaluate service tickets.
- Select the Data Fields : Identify the fields needed for the report. In this case, the data sources would be:
- Subscriber data: This might include user IDs, sign-up dates, package types, and subscription statuses.
- Invoice item data: Data related to billing, such as invoice dates, amounts, payment methods, items, and payment statuses.
- Ticket details: Information from customer support tickets like ticket IDs, creation dates, and issue categories.
- Determine Report Structure : Decide how you want to organize the information. This could involve sorting, grouping, or filtering the data in useful ways; for instance, by date, by subscriber package, or by issue type.
- Define Key Metrics : Establish which metrics are essential for the report. Examples include:
- Number of tickets added over a span of time
- Number of sign-ups
- Report Design : Choose how to display the data to make the data easily interpretable.
- Data Aggregation and Calculation : Write queries or set up formulas to calculate totals, averages, percentages, or other aggregates from the raw data.
- Apply Filters and Segments : Implement filters to allow users to view specific subsets of data (e.g., invoices for a particular month or tickets by severity level).
- Test the Report : Ensure all elements of the report are pulling in the correct data and that calculations are accurate.
- Iterate and Improve : Share the report with stakeholders to get feedback and make adjustments to the report as necessary.
- Documentation and Training : Provide documentation for the report, explaining what each metric means and how to use the report. Also, train relevant team members on how to interpret and act on the report data.
Access the Report Builder
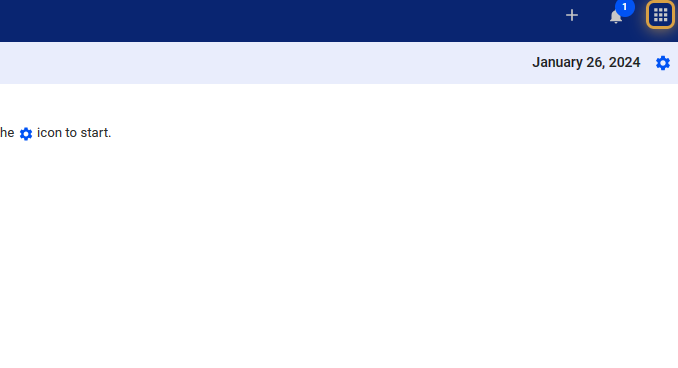
1. Click the nine-dot menu in the upper right corner to open the Visp Admin Page.
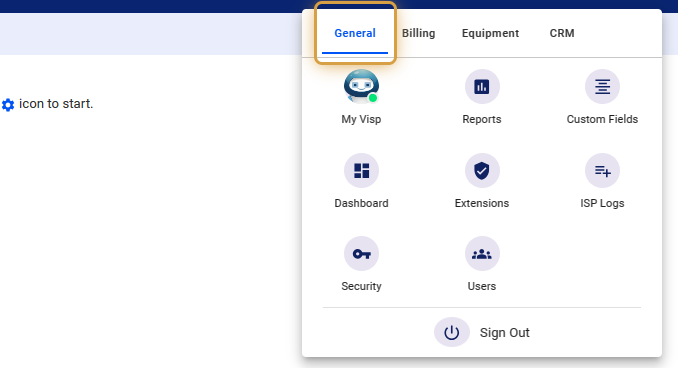
2. Click on the General tab.
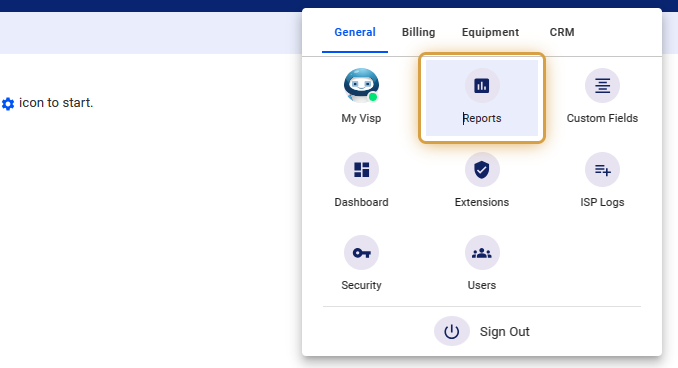
3. Select Reports
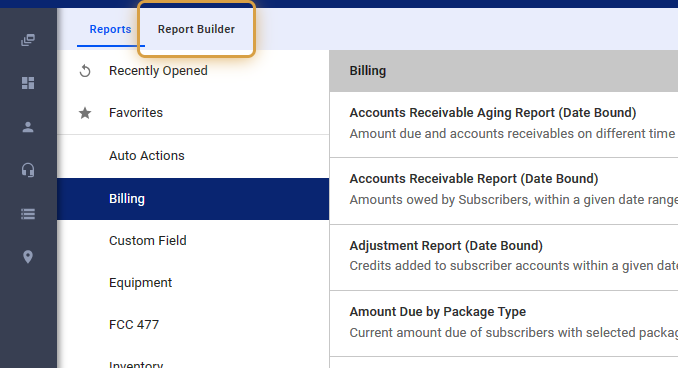
4. Click on Report Builder.
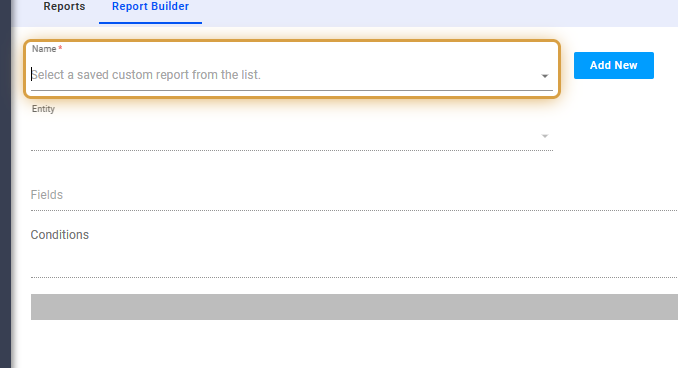
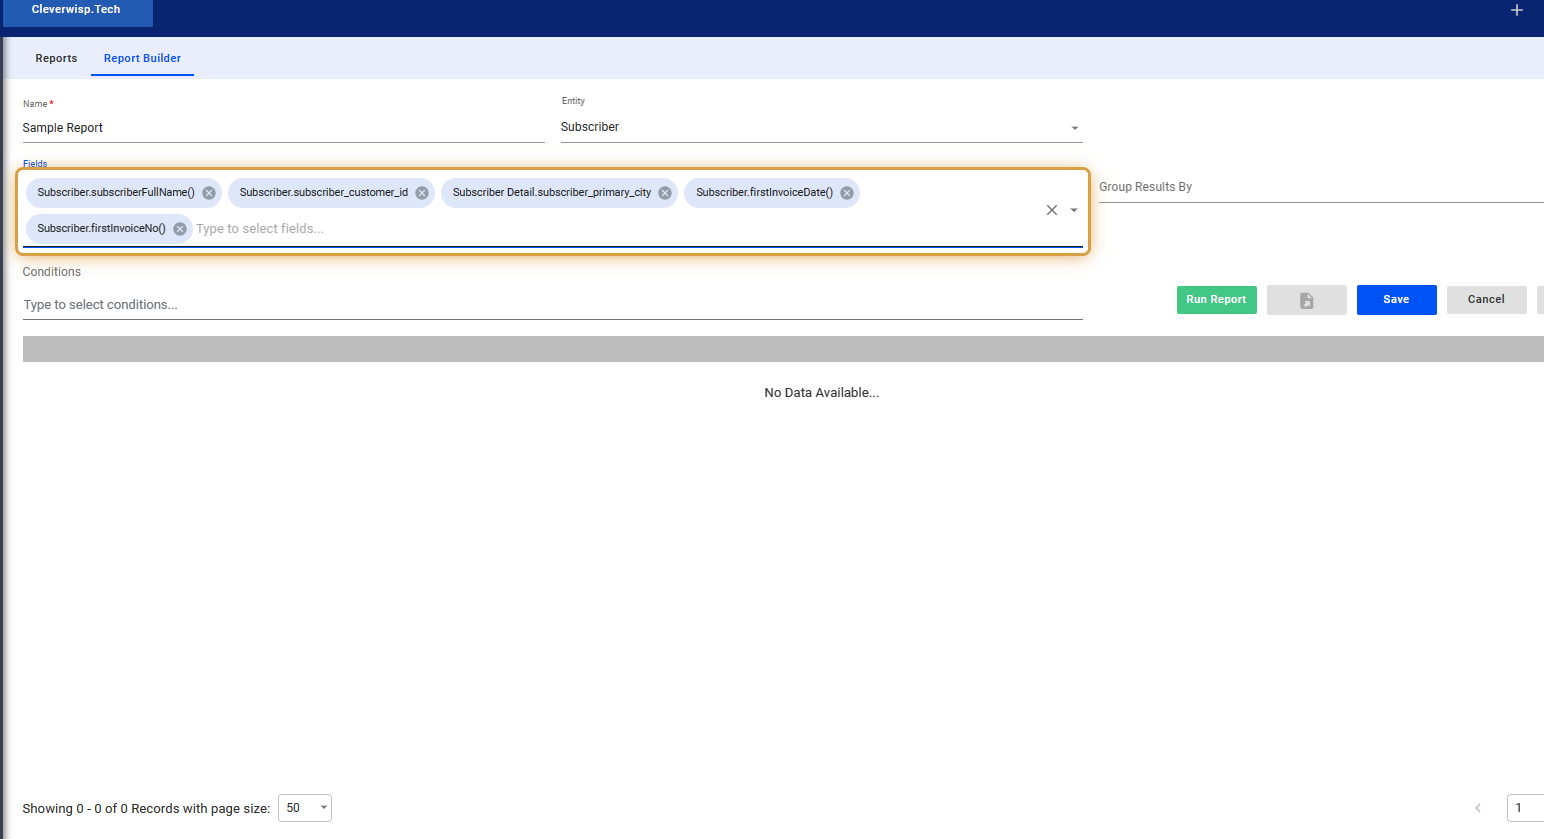
Create a Custom Report
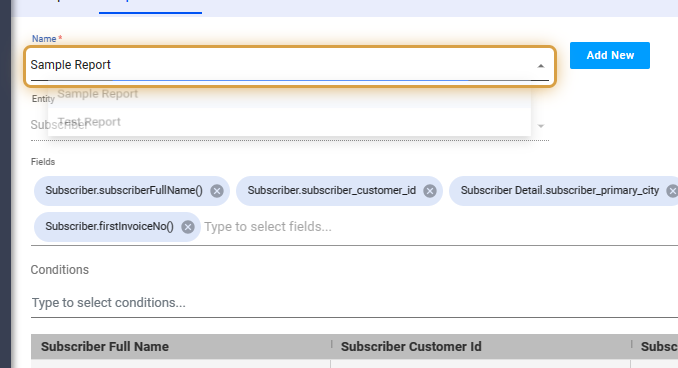
5. Input the name of the custom report.
6. If there’s a previously saved report, then select the report from the list.
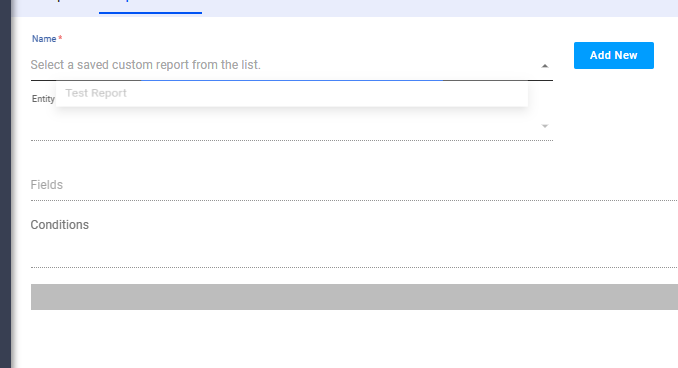
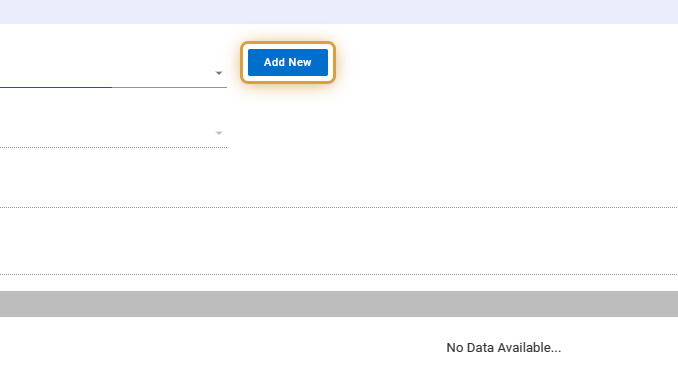
7. Click “Add New” to create a new report.
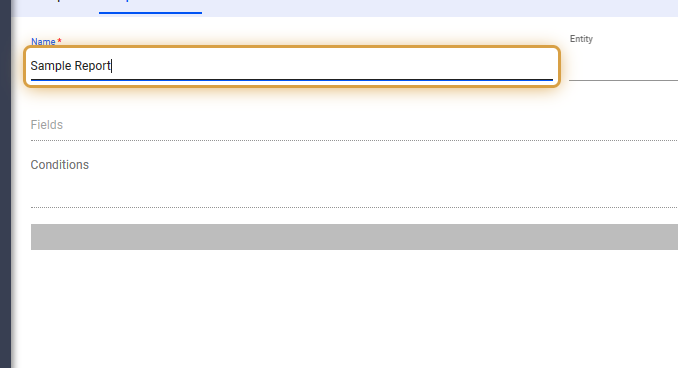
8. Input the name of the report.
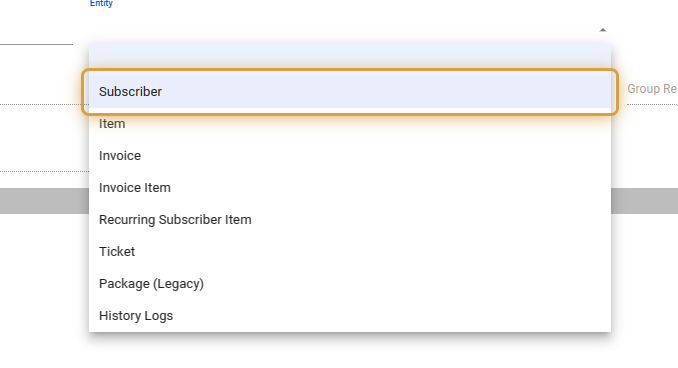
9. Select a data set from the available categories.
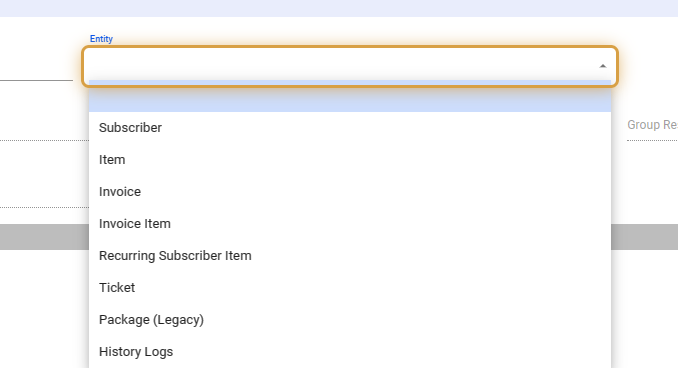
10. For this example, Subscriber is selected.
11. Click on the Fields dropdown, to select available data to populate.
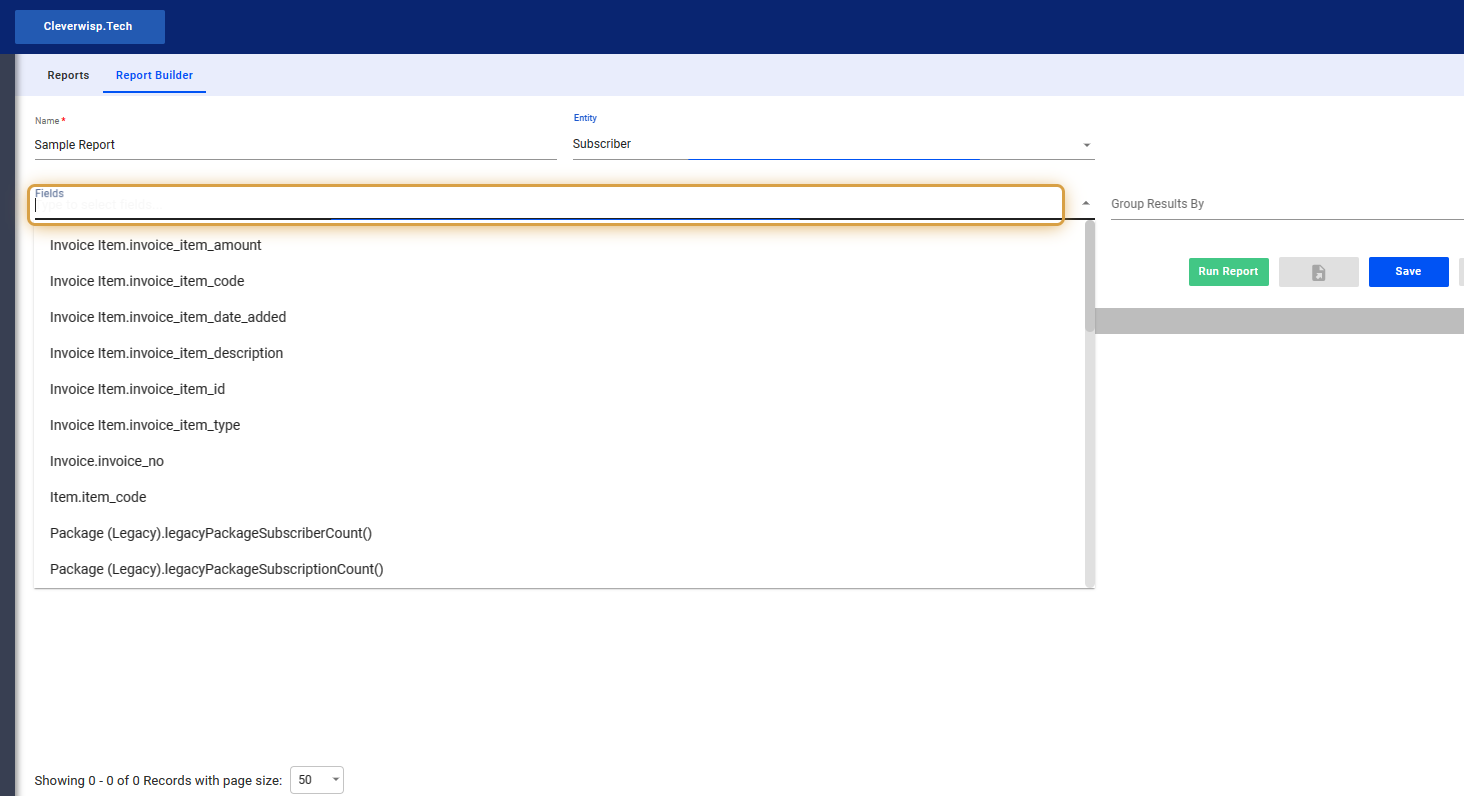
12. Add multiple data sets as necessary.
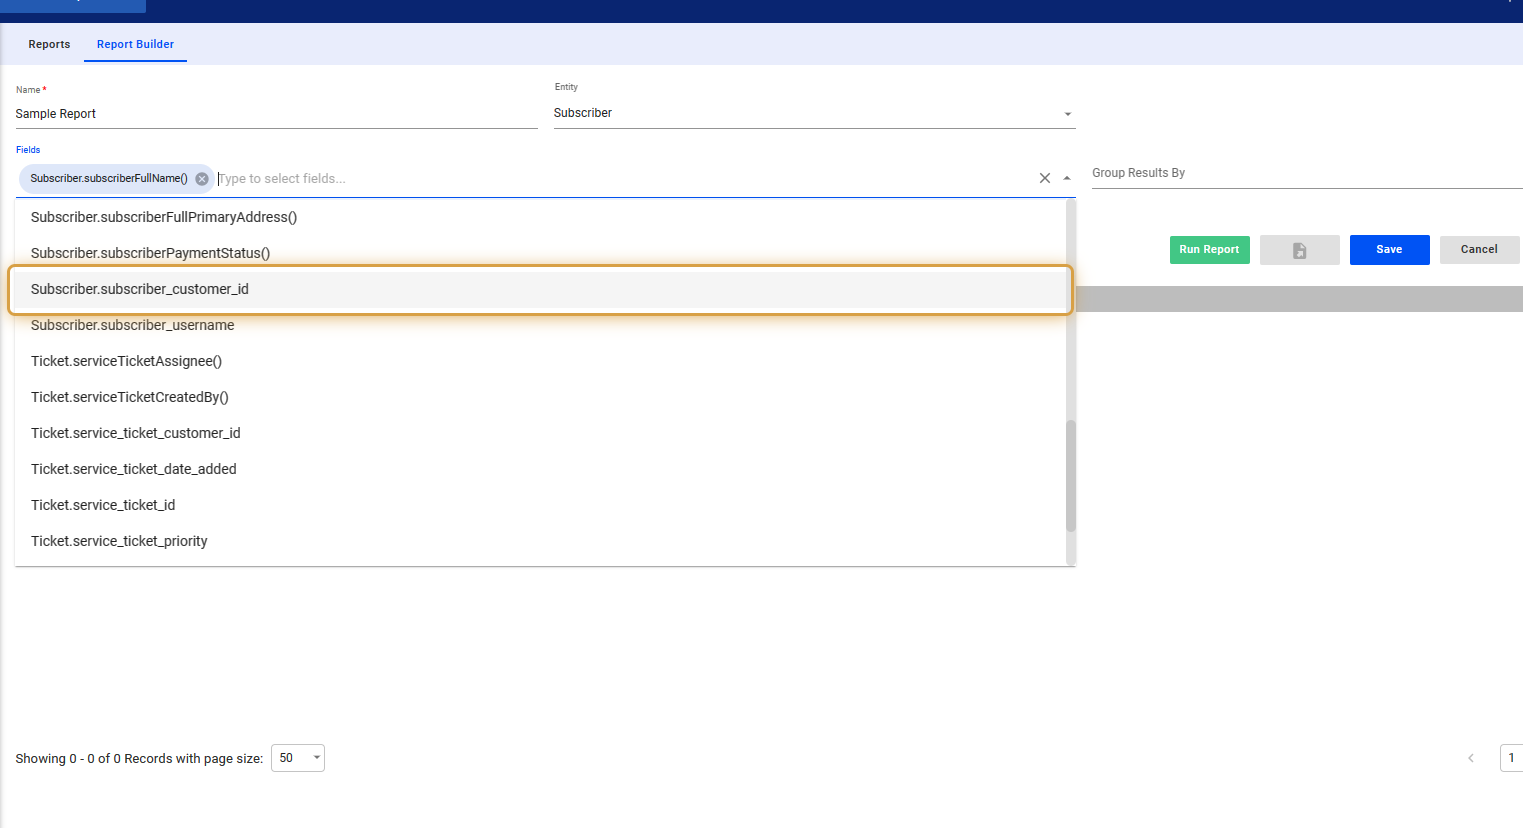
13. Determine the report purpose and structure based on the data sets added.
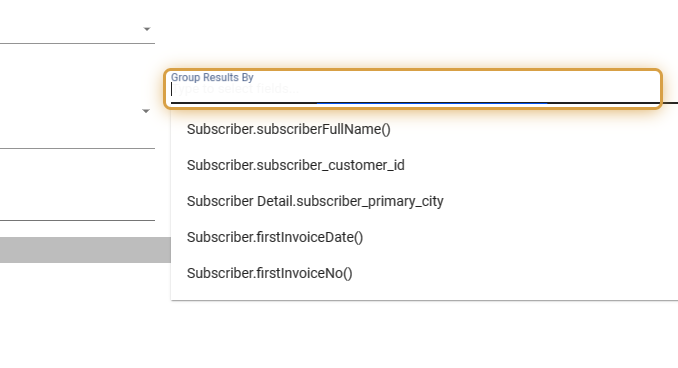
14. Group or filter results based on the available conditions.
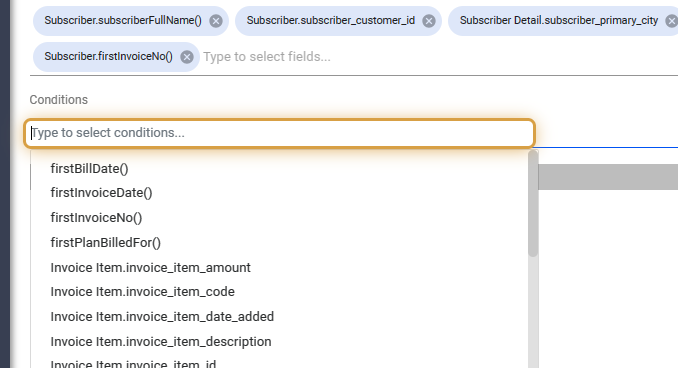
15. Set conditions using operators, to drill down the data.
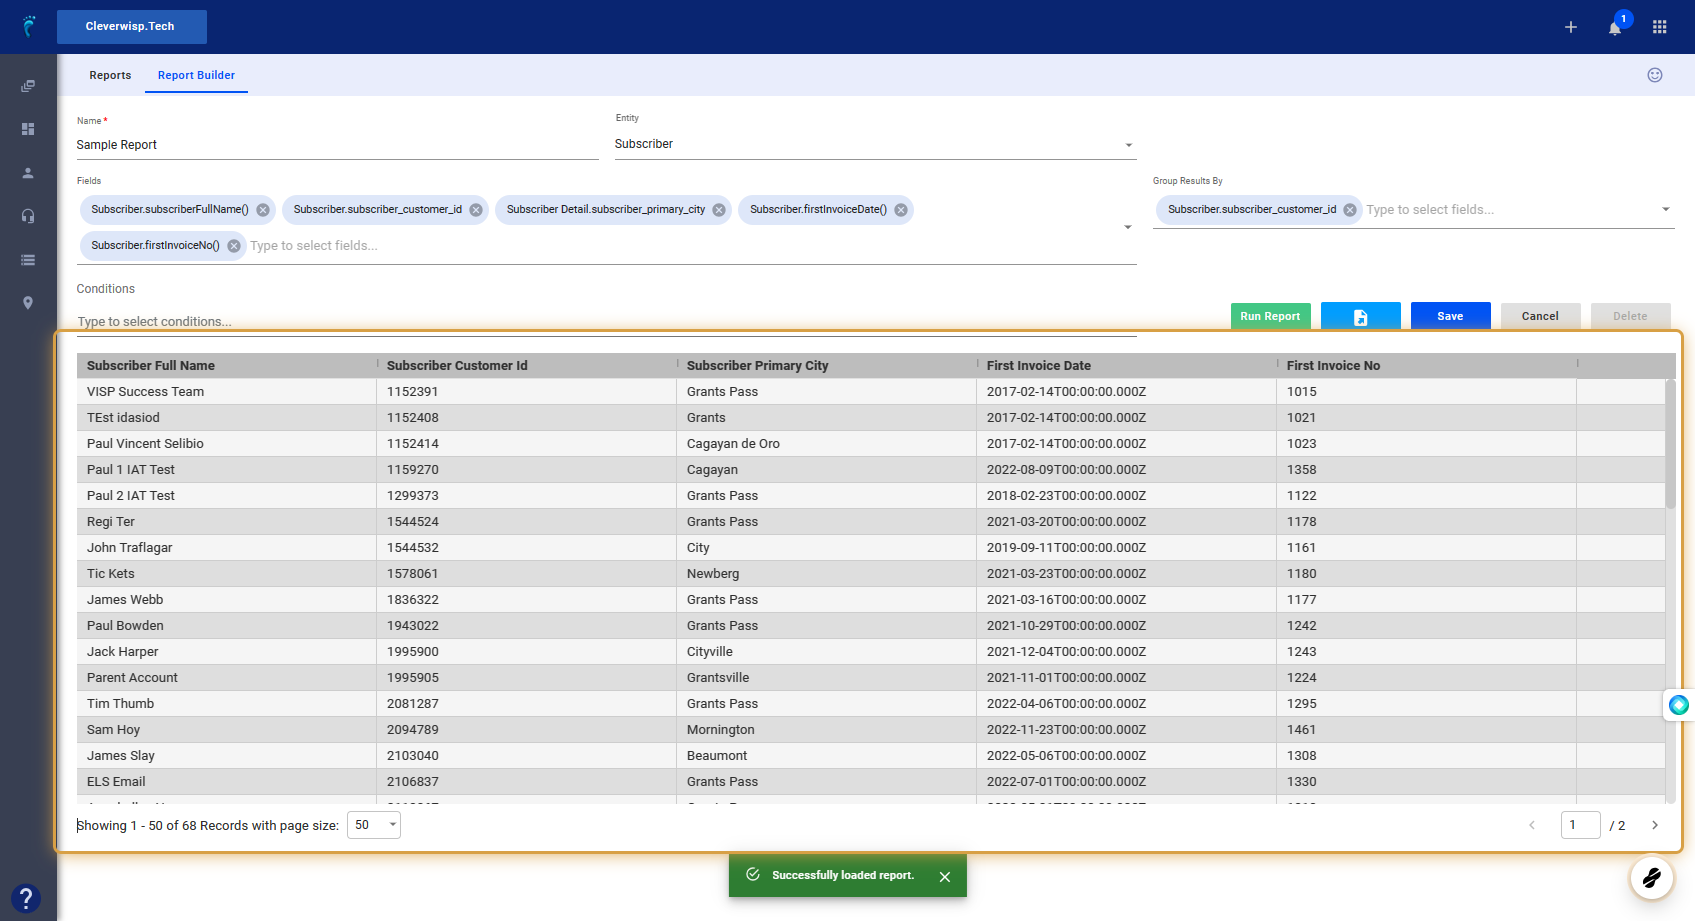
Generate the Report
16. Click on “Run Report” to populate the table.
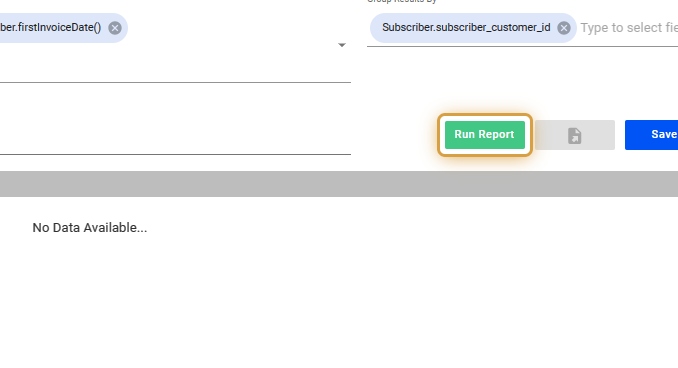
17. See generated report on the table.
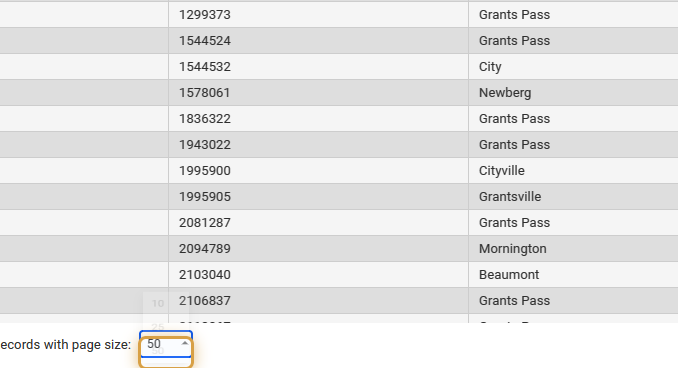
18. Limit the number of rows or items for your report by changing the records per page via the dropdown shown here.
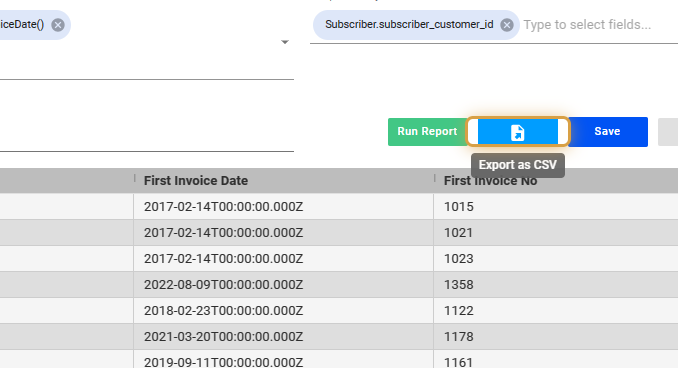
19. Click on the icon to export the report to CSV.
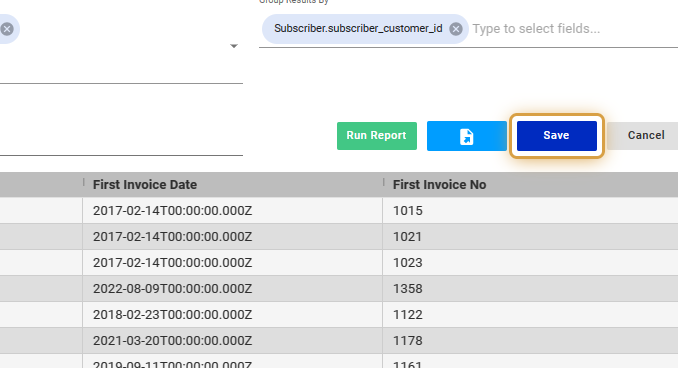
20. Save your changes.
21. You can now easily pull up the saved report by clicking on the Name dropdown in the Report Builder.
💡 For more information about this and all other features in Visp, reach out to your Visp Client Success Team today.
Phone: 541-955-6900Email: success@visp.net
Open a ticket via www.visp.net/ticket