

Use the Dashboard in your App Launcher or Settings menu to create and manage custom Dashboard report widgets.
Here are some tips when creating and using the dashboard widgets:
Be Clear and Concise When Naming Your Widgets
Clarity: Choose names that clearly describe the content and purpose of the widget.
- Consistency: Create a simple system for naming reports to keep them consistent, using specific beginnings or endings to show their purpose or which department they are for.
- Brevity: Use short names for easy recognition. Steer clear of names that are too lengthy or complicated to avoid confusion.
Assign Rights and Control User Access
- Authentication: Ensure that only authenticated users can access the dashboard and reports.
- Authorization: Once authenticated, use authorization mechanisms to determine what data and actions each user can view. E.g. Restrict some users from seeing total company revenue.
Customize for Easy Navigation
- Intuitive Layout: Organize your dashboard in a logical and easy way to navigate. Also, choose how to display the data visually, including the use of tables, graphs, or charts to make the data easily interpretable.
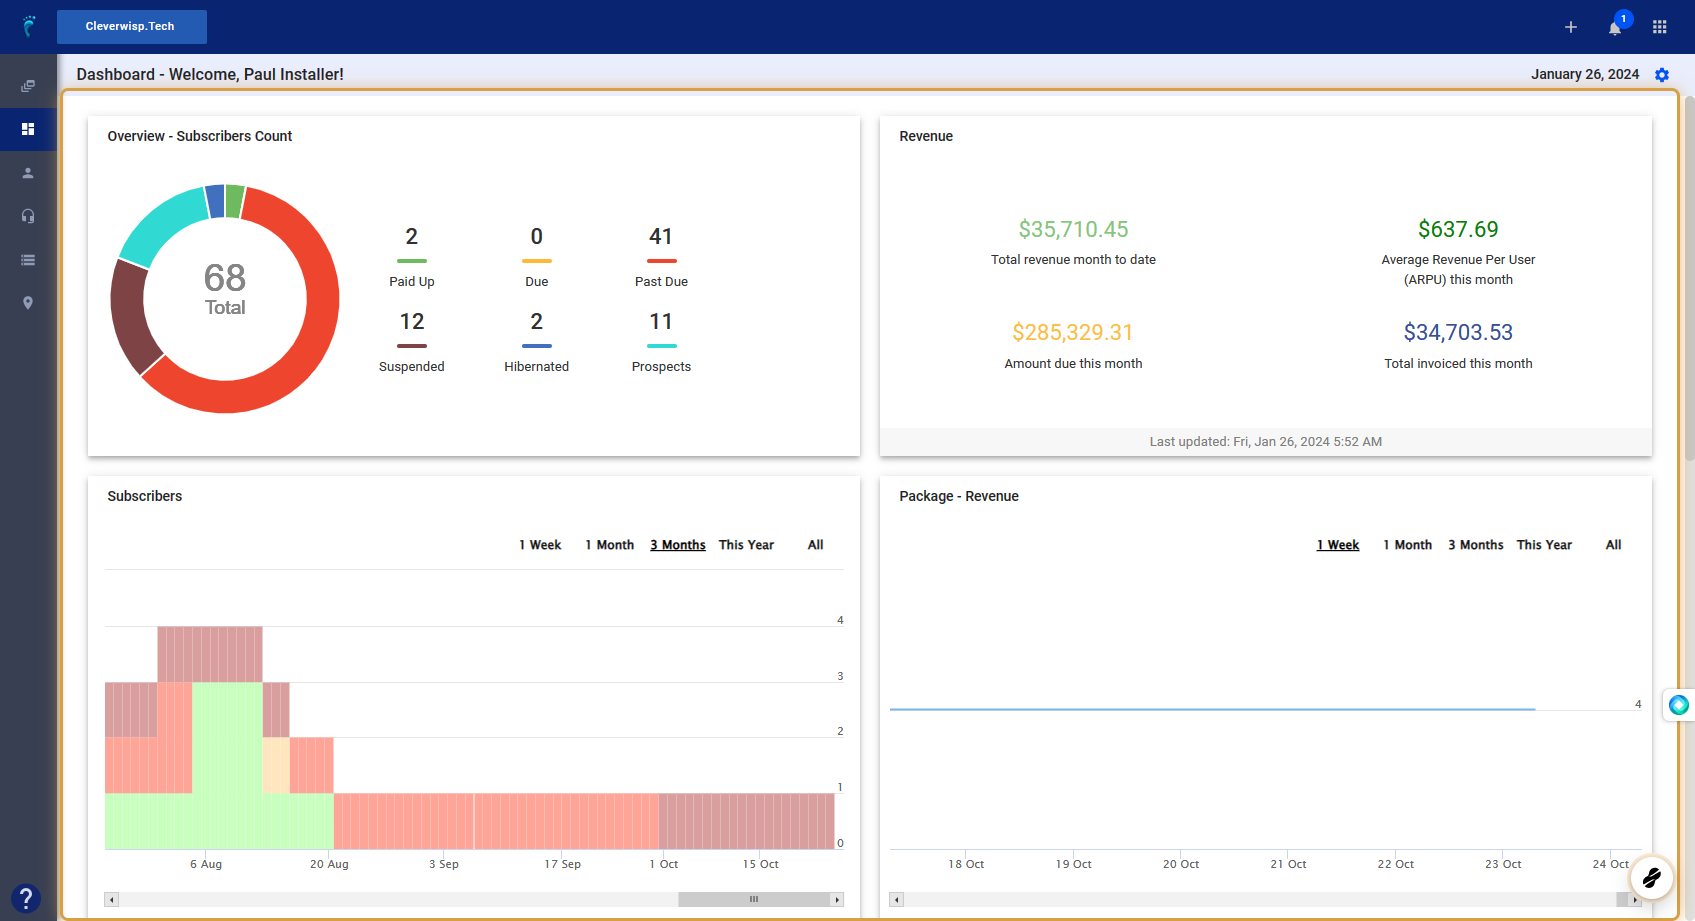
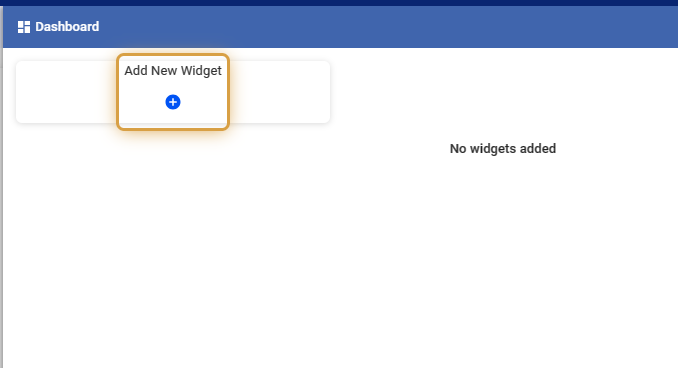
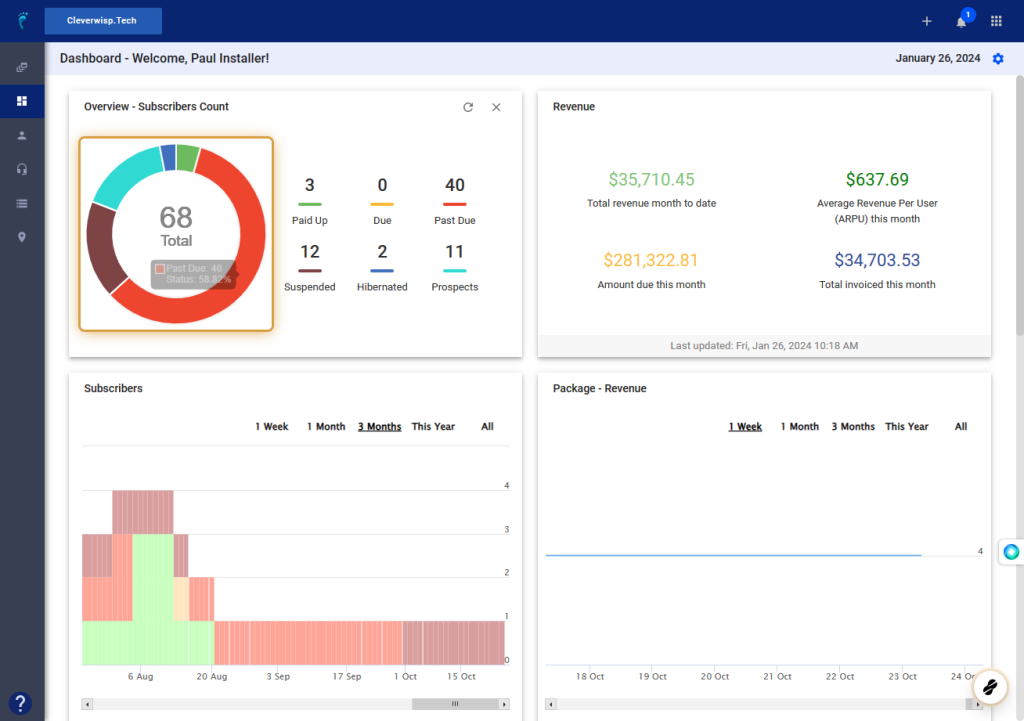
View Widgets
1. Click on the Dashboard to view all your available widgets.
Add New Custom Report Widgets
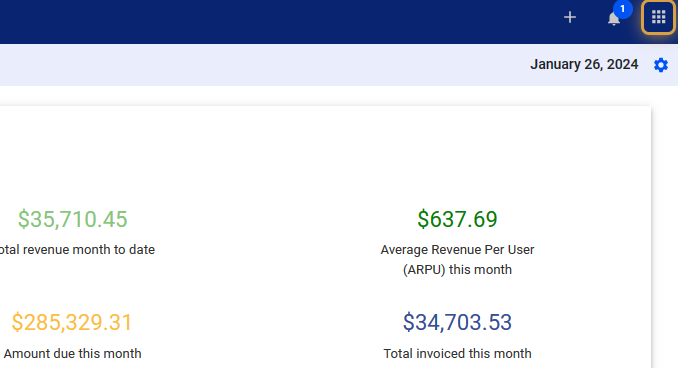
2. Click the nine-dot menu in the upper right corner to open the Visp Admin Page.
3. Click on General
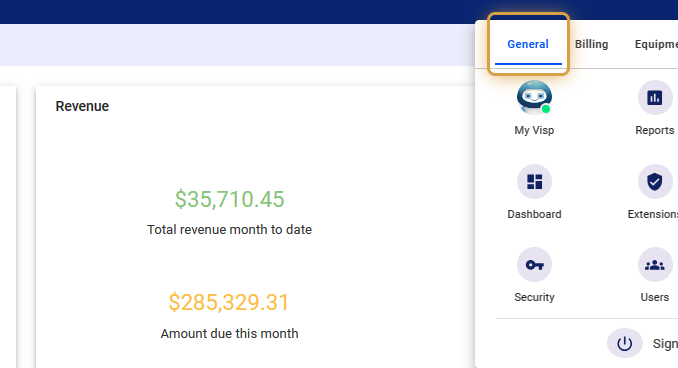
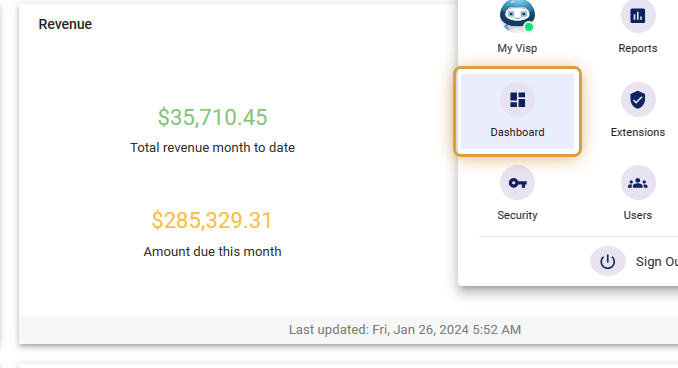
4. Select Dashboard
5. Click on Add New Widget
6. Input the Name of the Widget
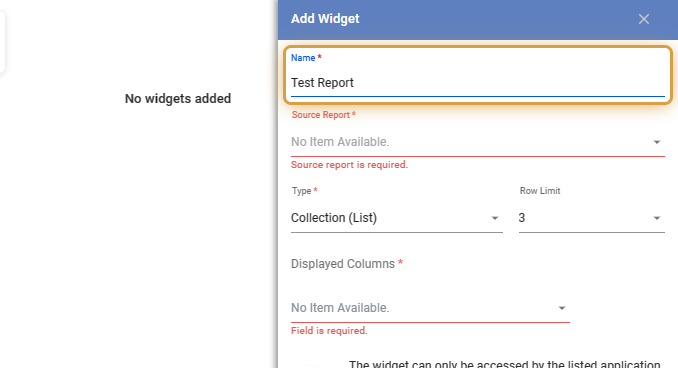
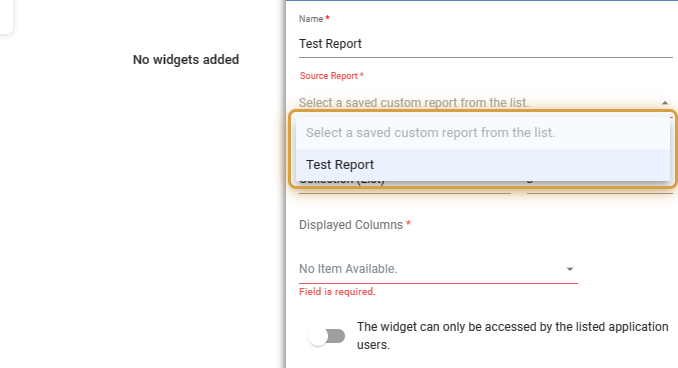
7. In Source Report, use the dropdown to select an existing Report.
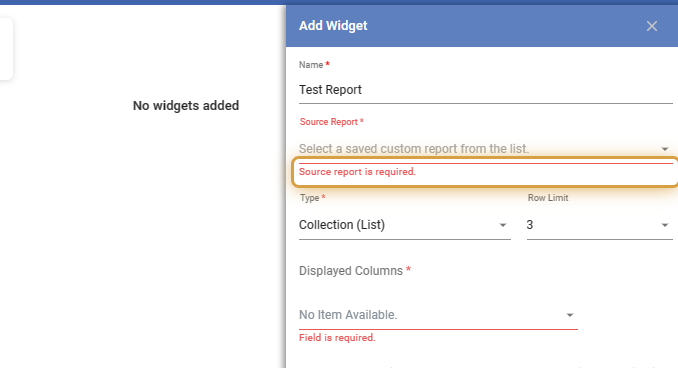
Note: Use the Report Builder feature to add new reports for use in Widgets.
8. Select the Report
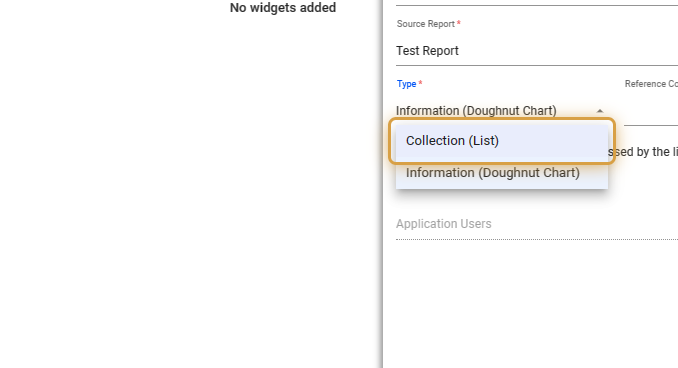
9. Use the dropdown in the Type field to select whether to display a list of data or the show a cart in the widget field.
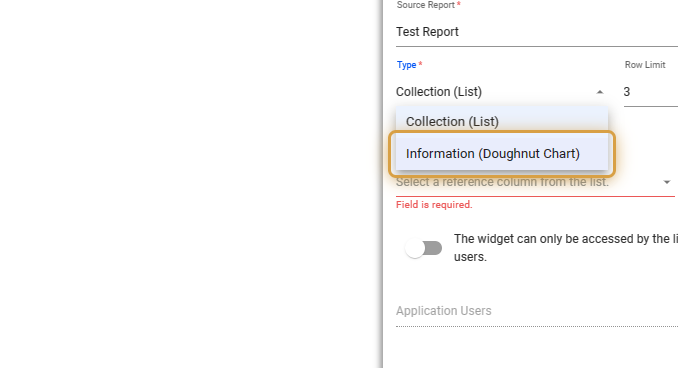
10. Select Collection (List)
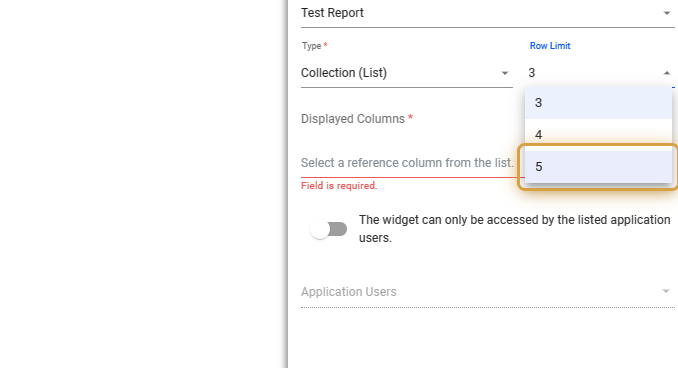
11. Use the dropdown in Row Limit to select the number of rows to view.
In this example, let’s use 5.
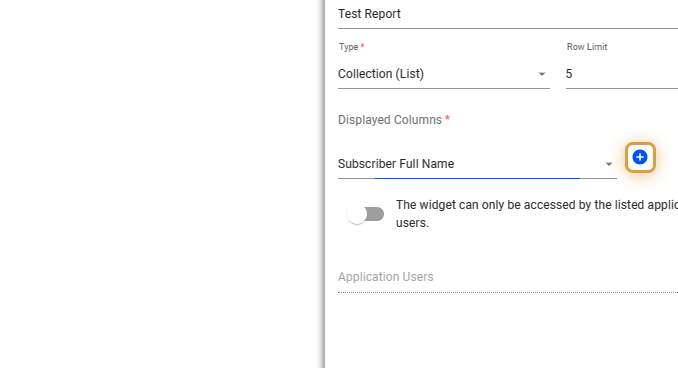
12. In Displayed Columns, use the dropdown to select and use an available header from the report as reference.
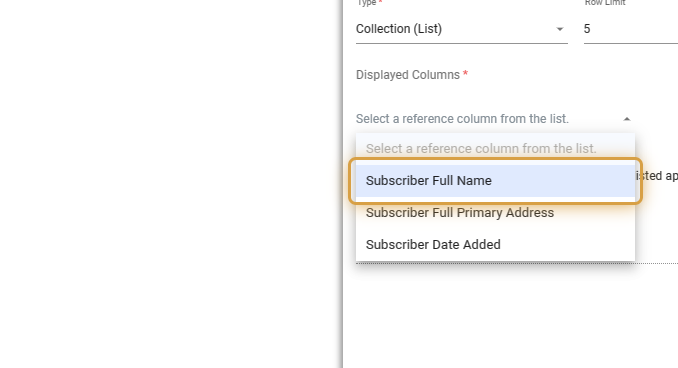
13. Click on the blue plus icon to add additional columns or fields.
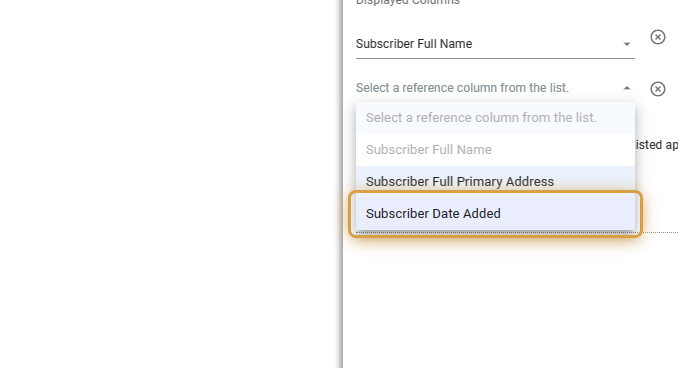
14. Use the dropdown to select additional columns to view.
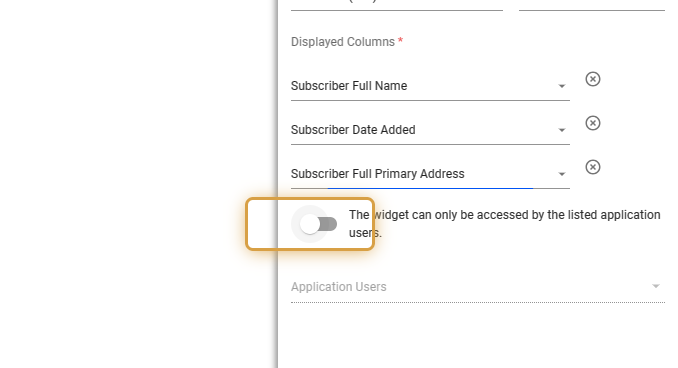
15. Toggle this option to restrict the use or display of the widget, for specific Users only.
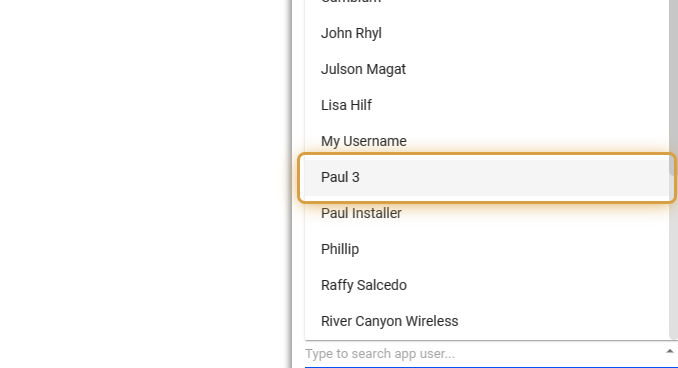
16. Use the dropdown to select the Users.
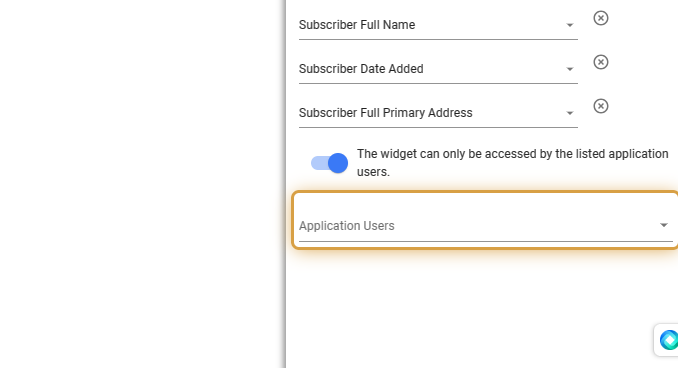
17. Select a User from the list.
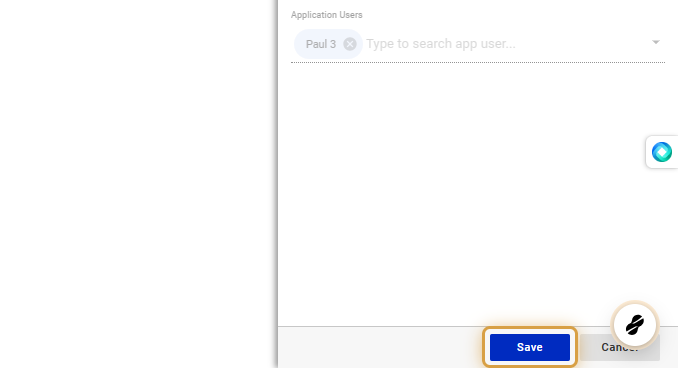
18. Save your work when done.
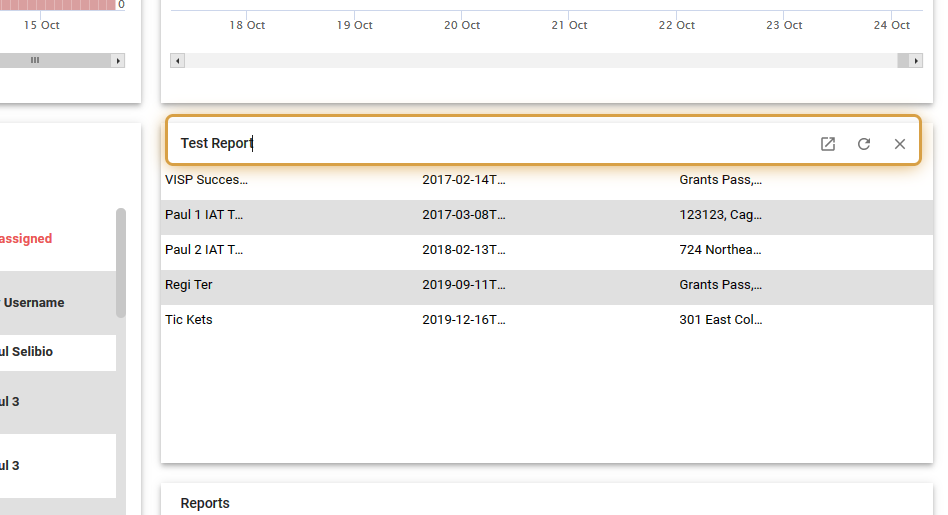
19. Your report widget is now available.
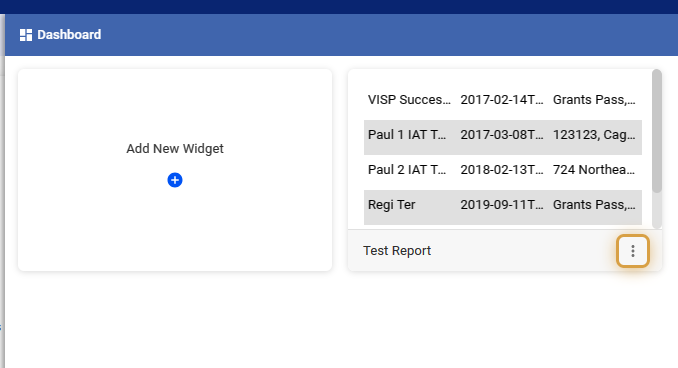
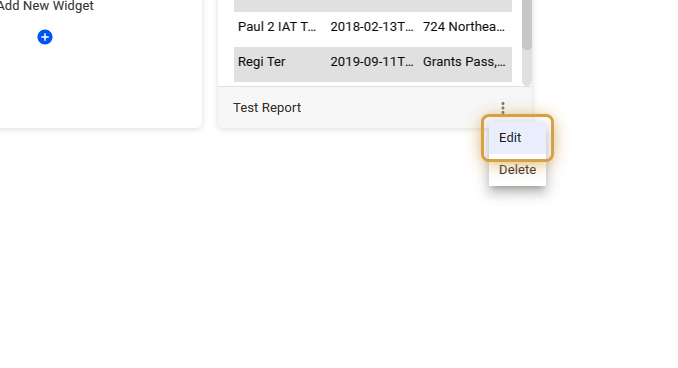
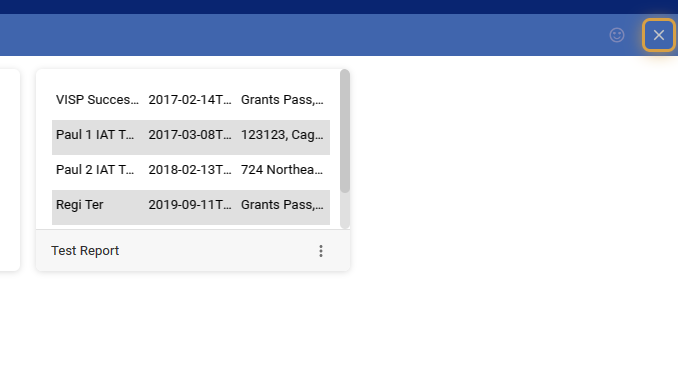
20. Click on the three dots or vertical ellipsis, to Edit or Delete the widget.
21. Click on the X icon to close the panel.
22. Your widget is now available from the Dashboard.
Display or Hide One or All Widgets on the Dashboard
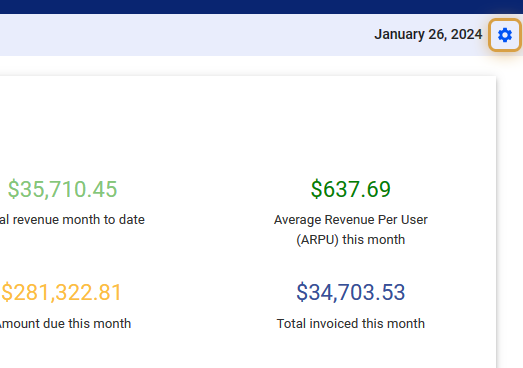
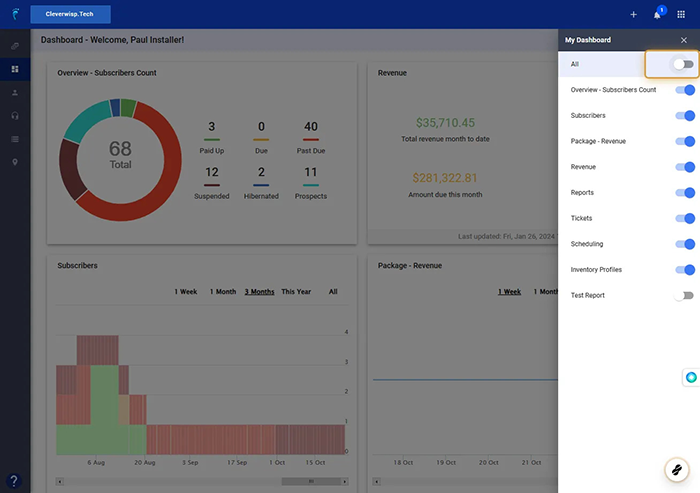
23. Go your Dashbord
24. Click on the gear icon on the upper-right of the page.
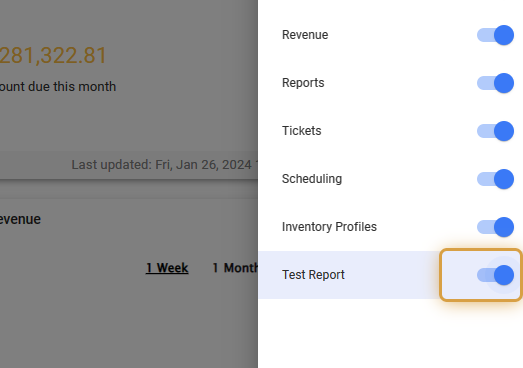
25. Enable or disable widgets.
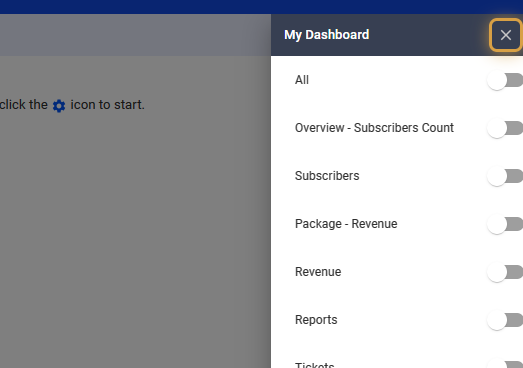
26. You can also enable or disable ALL widgets via this toggle.
27. Click on the X icon to close the panel.
💡 For more information about this and all other features in Visp, reach out to your Visp Client Success Team today.
Phone: 541-955-6900Email: success@visp.net
Open a ticket via www.visp.net/ticket