Documentation Series

Learn About VISP App Dashboard

Help Documentations / Reports / How to display reports on the dashboard?

How to display reports on the dashboard?

VISP dashboard is the first screen you will see when logging in to your account. It will provide you with useful information related to your billing account. It also allows you to display specific information to streamline your daily processes. This includes displaying reports through widgets.

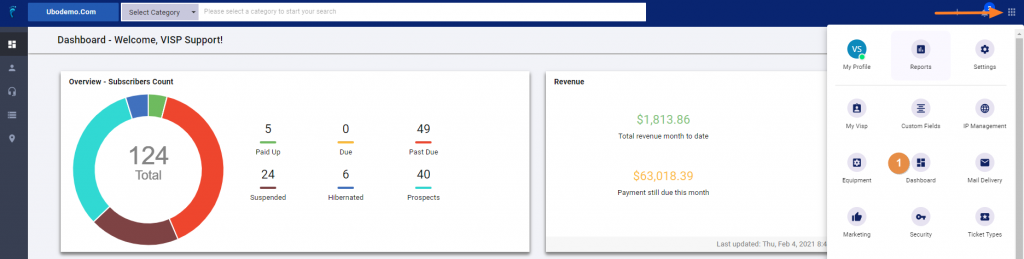
  1. To display the specific report on the dashboard, go to Main Menu >  General Tab > Dashboard.Display reports - Visp App
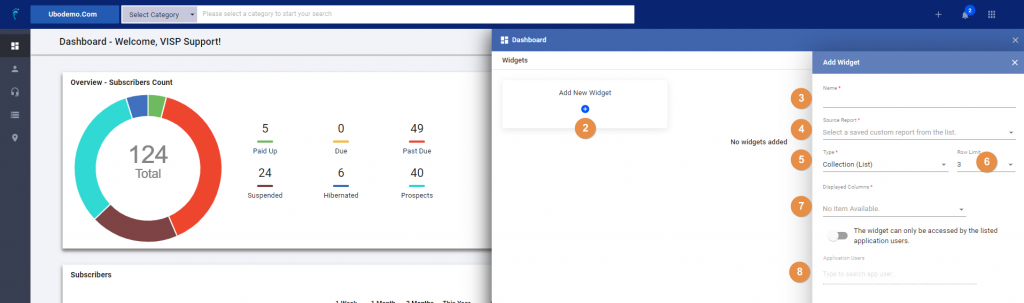
  2. Click on the Add New widget button
  3. Type a name for your widget
  4. Select the report you want to display on the widget.
  5. Select the type of report. A collection report shows you a list of data. The information type shows you a visual doughnut chart.
  6. Select the number of rows you want to display.
  7. Select which column to display.
    How to display reports on the dashboard - Visp App Documentation
  8. Allow other users to see the report by enabling the option, and by selecting their username.
  9. Save your work to generate the widget.
  10. Finally, go back to the Dashboard to activate the new widget.

1. Generate your FCC 477 Subscription and Deployment Reports.

To generate your FCC 477 Subscription and Deployment Reports in VISP, go to your Reports > FCC 477. Select the report(s) you want to generate. Note: In order to generate your FCC Broadband Deployment Report, your site or tower information must be added in VISP,…

2. Checking a Subscriber’s Usage

Account Manager Each subscriber can monitor his/her usage via the online Account Manager. As the ISP Administrator, you can also do this and you also have access to an exclusive usage report about all of your involved subscribers. You and, to a certain extent, your…

3. How to display reports on the dashboard?

VISP dashboard is the first screen you will see when logging in to your account. It will provide you with useful information related to your billing account. It also allows you to display specific information to streamline your daily processes. This includes…

4. Report Builder

A report builder is a tool that allows users to provide entities and conditions to generate a custom report. How to Use the Report Builder? Go to the Main Menu > Reports. Click on the Report Builder tab Create a new report by clicking on the Add New button. Type…

5. Reports in VISP

You can view the Reports Center and all available reports in VISP by going to the menu. Click on the General tab. Select Reports. Reports are organized into different categories. For Billing related reports, for example, click here. You will notice to the right of a…

6. Report Reference

REPORT TYPE VISP Reports LEADS 1 Total Active Leads Reports > Subscriber > New User Report (Date Bound) 2 Newly Added Active Leads (weekly) New User Report (Date Bound) 3 Newly Lost Leads (weekly) Deleted Customers Report 4…

7. ISP Logs

The ISP log section serves as a historical audit trail within the system, allowing for the search and review of specific changes based on user actions. Features include: A search bar for pinpointing specific details within the log. A date range filter to narrow down…

8. Report Builder

Visp’s Report Builder lets you create custom reports where you can choose the fields and set specific conditions. Here are some tips when adding new reports: Define the Purpose of the Report : Determine what questions this report is meant to answer. For example, it…

9. Dashboard Widgets

Use the Dashboard in your App Launcher or Settings menu to create and manage custom Dashboard report widgets. Here are some tips when creating and using the dashboard widgets: Be Clear and Concise When Naming Your Widgets Clarity: Choose names that clearly describe…
?