

In the UBO, you can access the Reports Center by clicking on the Reports menu.
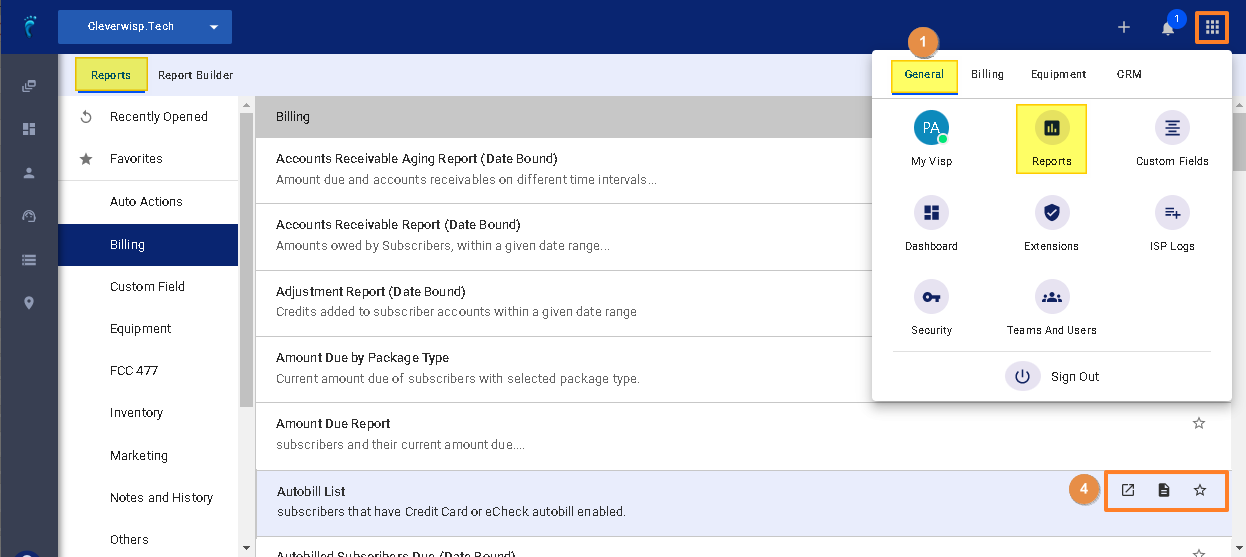
You can view the Reports Center and all available reports in the VISP Web App by going to the App launcher menu in the upper-right corner of the screen.
- Click on the
General tab. - Select
Reports. - Reports are organized into different categories.
- For Billing related reports, for example, click here.
- You will notice to the right of a specific report you have several options available.
- To open the report in a new tab, click on the external link icon.
- To export the report to a CSV file, click on the note icon right in the middle of the external link and the favorite icon.
- Lastly, to bookmark or save the report to your Favorites, click on the star icon.
- Your report should now appear in the Favorites section.
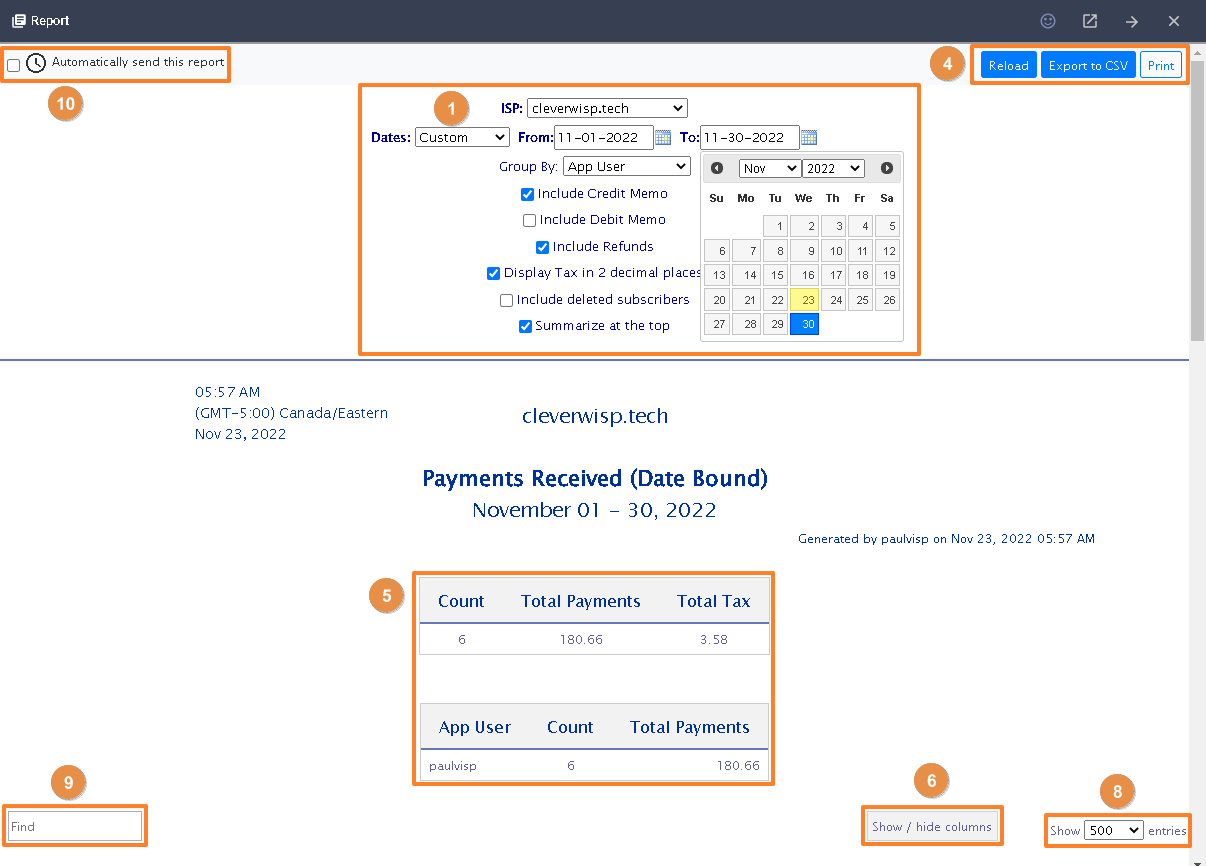
- A report may be date-bound, meaning you can sort the data according to a specific date range.
- If you’re using multiple brands, select an ISP or account from the dropdown.
- Whenever you make changes to the options or enable or disable additional criteria, reload the report to refresh the data.
- Here you can also Export the report to a CSV file or send it to your printer, or export a PDF copy of your current view.
- Some reports may contain a summary of the different sets or categories of data being displayed. Other reports will not have this information.
- You can display additional columns on the report by clicking on the Show/Hide columns option, if available.
- Check the box of the columns you want to see and uncheck the columns you want to be hidden from view.
- You may limit the number of entries displayed on the report. The more entries shown on a single page, the more time it will take for the data to load. Scroll to the bottom of the report to open different data pages.
- To filter reports based on available data from any of the categories, use the Find bar.
-
- In this example, let’s filter New Customers based on City.
- Type the city on the Find bar, and you will see the data filtered in real-time.
- You can export a copy of your current or filtered view by clicking on the Export to CSV button.
- After downloading your CSV file, you can make additional customizations via your spreadsheet application.
-
- You may receive snapshots of your report for a given period. Enable the option to “Automatically send this report” to a specific user.
-
- Select the Frequency of the report.
- And then add the email address of your recipient.
- You may select additional options of information to be included if available.
- Save your work when done.
-
For more information about this and all other features in VISP, reach out to your VISP Client Success Team today.